Revision Library
Choose a subject
Menu

Book 3 of 3

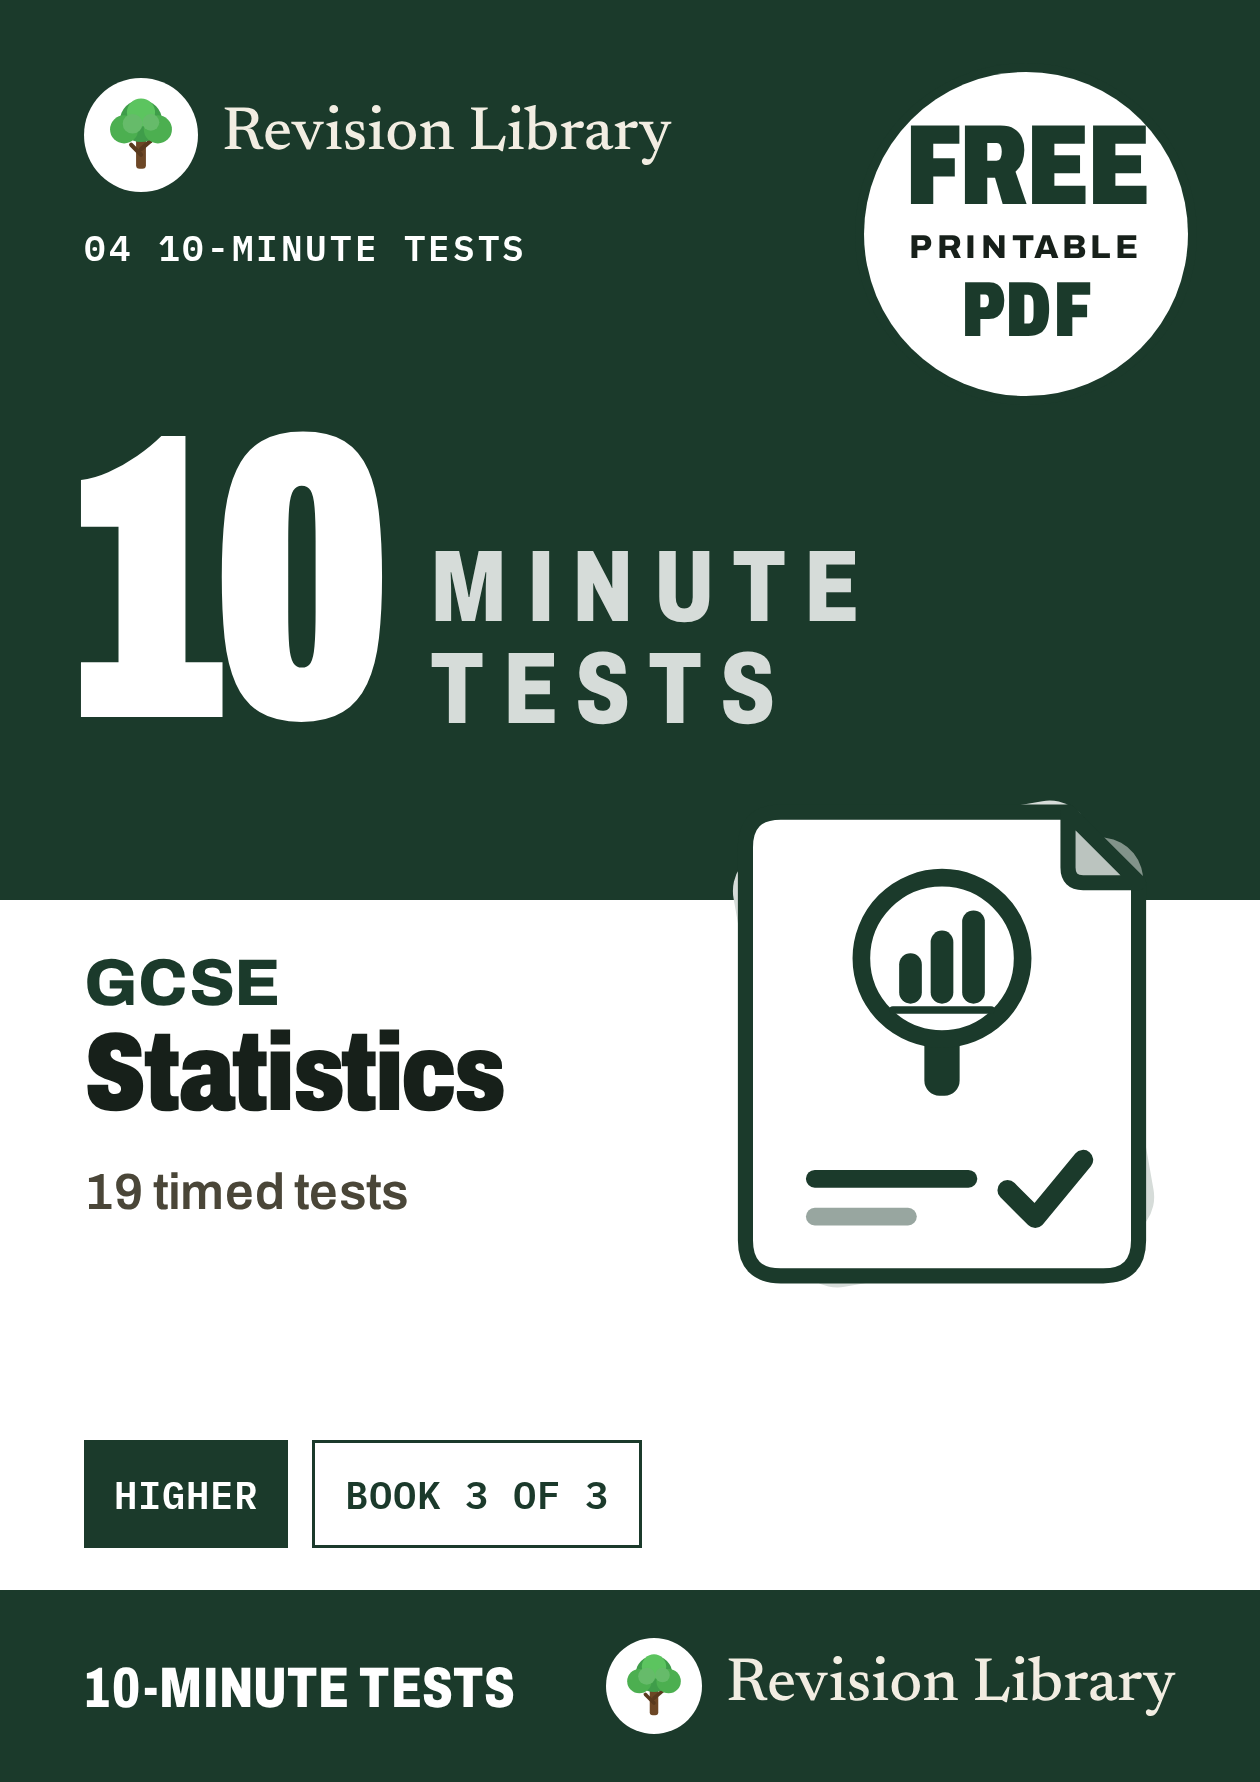
GCSE Statistics Higher 10-Minute Tests 3

Spearman's Rank Correlation, Regression and the PMCC, Time Series and Moving Averages and 16 more

Level
GCSE Higher · Edexcel 1ST0
Series
GCSE Statistics Higher 10-Minute Tests, book 3 of 3
Suitable for
Years 10-11, Edexcel
FreePDF download · 2027 edition · 74 A4 pages
  • One file, prints straight to A4
  • No account, no password

Workbooks like this one, with 19 topics, 63 questions and mark schemes at the back, are usually printed and sold by publishers. This one is one of 558 free PDFs on the shelf.

Pages
74 A4 pages
Chapters
19 worksheet chapters
Questions
63
Answers
From page 56
Working time
About 3h 10m

What is inside

19 chapters · answers from p56

Each chapter starts with a page showing its marks and a suggested time, followed by the questions. The mark schemes for all 19 chapters are at the back, so the book works for homework, a timed test or revision.

  1. 01Spearman's Rank Correlation3 questions · about 10 min Topic guide: Spearman's Rank Correlationp3
  2. 02Regression and the PMCC2 questions · about 10 min Topic guide: Regression and the PMCCp6
  3. 03Time Series and Moving Averages6 questions · about 10 min Topic guide: Time Series and Moving Averagesp8
  4. 04Scatter Graphs and Line of Best Fit2 questions · about 10 min Topic guide: Scatter Graphs and Line of Best Fitp11
  5. 05Time Series2 questions · about 10 min Topic guide: Time Seriesp13
  6. 06Risk (Higher)3 questions · about 10 min Topic guide: Risk (Higher)p16
  7. 07Conditional Probability (Higher)4 questions · about 10 min Topic guide: Conditional Probability (Higher)p19
  8. 08The General Addition Law3 questions · about 10 min Topic guide: The General Addition Lawp22
  9. 09Probability Basics and the Probability Scale5 questions · about 10 min Topic guide: Probability Basics and the Probability Scalep24
  10. 10Mutually Exclusive Events6 questions · about 10 min Topic guide: Mutually Exclusive Eventsp27
  11. 11Sample Space Diagrams3 questions · about 10 min Topic guide: Sample Space Diagramsp30
  12. 12Relative and Expected Frequency4 questions · about 10 min Topic guide: Relative and Expected Frequencyp33
  13. 13Venn Diagrams2 questions · about 10 min Topic guide: Venn Diagramsp36
  14. 14Tree Diagrams2 questions · about 10 min Topic guide: Tree Diagramsp39
  15. 15Crude and Standardised Rates3 questions · about 10 min Topic guide: Crude and Standardised Ratesp41
  16. 16Weighted and Chain Base Index Numbers3 questions · about 10 min Topic guide: Weighted and Chain Base Index Numbersp43
  17. 17Index Numbers3 questions · about 10 min Topic guide: Index Numbersp46
  18. 18The Normal Distribution4 questions · about 10 min Topic guide: The Normal Distributionp49
  19. 19The Binomial Distribution3 questions · about 10 min Topic guide: The Binomial Distributionp52
  20. AnswersMark schemes for every chapterp56

Each chapter is drawn from one of our worksheet packs. Follow a chapter title for the full pack on its own page, or browse every GCSE Statistics pack. Every book on the shelf is a complete printable workbook of up to 120 A4 pages.

Explore this volume

GCSE Statistics Higher 10-Minute Tests 3 includes Spearman's Rank Correlation (from page 3); Regression and the PMCC (from page 6); Time Series and Moving Averages (from page 8); Scatter Graphs and Line of Best Fit (from page 11); Time Series (from page 13); Risk (Higher) (from page 16); Conditional Probability (Higher) (from page 19); The General Addition Law (from page 22); Probability Basics and the Probability Scale (from page 24); Mutually Exclusive Events (from page 27); Sample Space Diagrams (from page 30); Relative and Expected Frequency (from page 33); Venn Diagrams (from page 36); Tree Diagrams (from page 39); Crude and Standardised Rates (from page 41); Weighted and Chain Base Index Numbers (from page 43); Index Numbers (from page 46); The Normal Distribution (from page 49); The Binomial Distribution (from page 52).

Worked question 6 - Mutually Exclusive Events

Open the included worksheet

A gym reports that 65% of members use the pool and 50% use the gym floor. The manager claims: "Since 65%+50%=115%, this proves at least 15% of members use both facilities." Explain whether the manager's reasoning is valid, and show the minimum percentage of members who must use both.

Answer and mark scheme

Question 6

CreditAnswer or working
M1recognises that the probability of using at least one facility cannot exceed 100%
A165+50-100 = 15 shown, oe
B1concludes the manager's reasoning is valid: at least 15% of members must use both facilities
  • Answer: The manager's reasoning is valid. Since P(pool or gym floor) cannot exceed 100%, P(both) ≥ 65+50-100 = 15%, so at least 15% of members must use both.

Question 1 - Mutually Exclusive Events

Open the included worksheet

A card is drawn from a standard 52-card pack. State whether the events 'drawing a King' and 'drawing a Heart' are mutually exclusive.

Answer and mark scheme

Question 1

CreditAnswer or working
B1not mutually exclusive - the King of Hearts is both a King and a Heart, oe
  • Answer: Not mutually exclusive

Question 2 - Mutually Exclusive Events

Open the included worksheet

State the mathematical term for two or more events that, between them, cover every possible outcome.

Answer and mark scheme

Question 2

CreditAnswer or working
B1exhaustive cao
  • Answer: Exhaustive

Question 4 - Time Series and Moving Averages

Open the included worksheet

The first three 4-point moving averages for a cafe's quarterly sales are 40, 42, 44. State whether the trend is increasing, decreasing, or roughly constant.

Answer and mark scheme

Question 4

CreditAnswer or working
B1Increasing cao
  • Answer: Increasing

Question 1 - Time Series and Moving Averages

Open the included worksheet

State the name given to a pattern that rises and falls in the same way at the same point in every year, such as ice lolly sales rising every summer.

Answer and mark scheme

Question 1

CreditAnswer or working
B1Seasonal variation cao
  • Answer: Seasonal variation

Question 1 - Regression and the PMCC

Open the included worksheet

The data below could be plotted on a scatter graph. A teacher records hours spent revising (x) and test mark (y).
x467811141819
y5456585866687778

A line of best fit is drawn so that it passes through the points (6, 56) and (18, 77).
(a) Work out the gradient of the line.
(b) Find the equation of the line in the form y = mx + c.

Answer and mark scheme

Question 1

CreditAnswer or working
M1change in y divided by change in x
A1gradient 1.75 cao
M1substitutes a point into y = mx + c
A1y = 1.75x + 45.5 cao
  • Answer: (a) 1.75; (b) y = 1.75x + 45.5

Question 1 - Spearman's Rank Correlation

Open the included worksheet

The Spearman rank correlation coefficient between hours of practice and performance score for a group is rs = 0.09.
(a) Describe the correlation. Use: very strong (0.8 or more in size), strong (0.6 up to 0.8), moderate (0.4 up to 0.6), weak (under 0.4).
(b) What does the sign of rs tell you about how the ranks of hours of practice and performance score are related?

Answer and mark scheme

Question 1

CreditAnswer or working
B1positive
B1weak
B1as ranks of one increase the ranks of the other increase oe
  • Answer: (a) weak positive; (b) as ranks of hours of practice increase, ranks of performance score increase

GCSE Statistics Higher 10-Minute Tests runs to 3 volumes

Book 3 of 3 · 241 pages in the set

Each book is a separate free PDF.

Volume 1

81 pp · 71 Qs

Stratified Sampling (Higher), Capture Recapture, Estimating from Samples (Higher) and 17 more

Volume 2

86 pp · 70 Qs

Pie Charts, Stem and Leaf Diagrams, Histograms and 18 more

Volume 3 · this book

74 pp · 63 Qs

Spearman's Rank Correlation, Regression and the PMCC, Time Series and Moving Averages and 16 more

More GCSE Higher books

Want a different mix of topics?

Sitting an exam soon? Build a GCSE Statistics mock paper or print a ready-made one.