Revision Library
Choose a subject
Menu

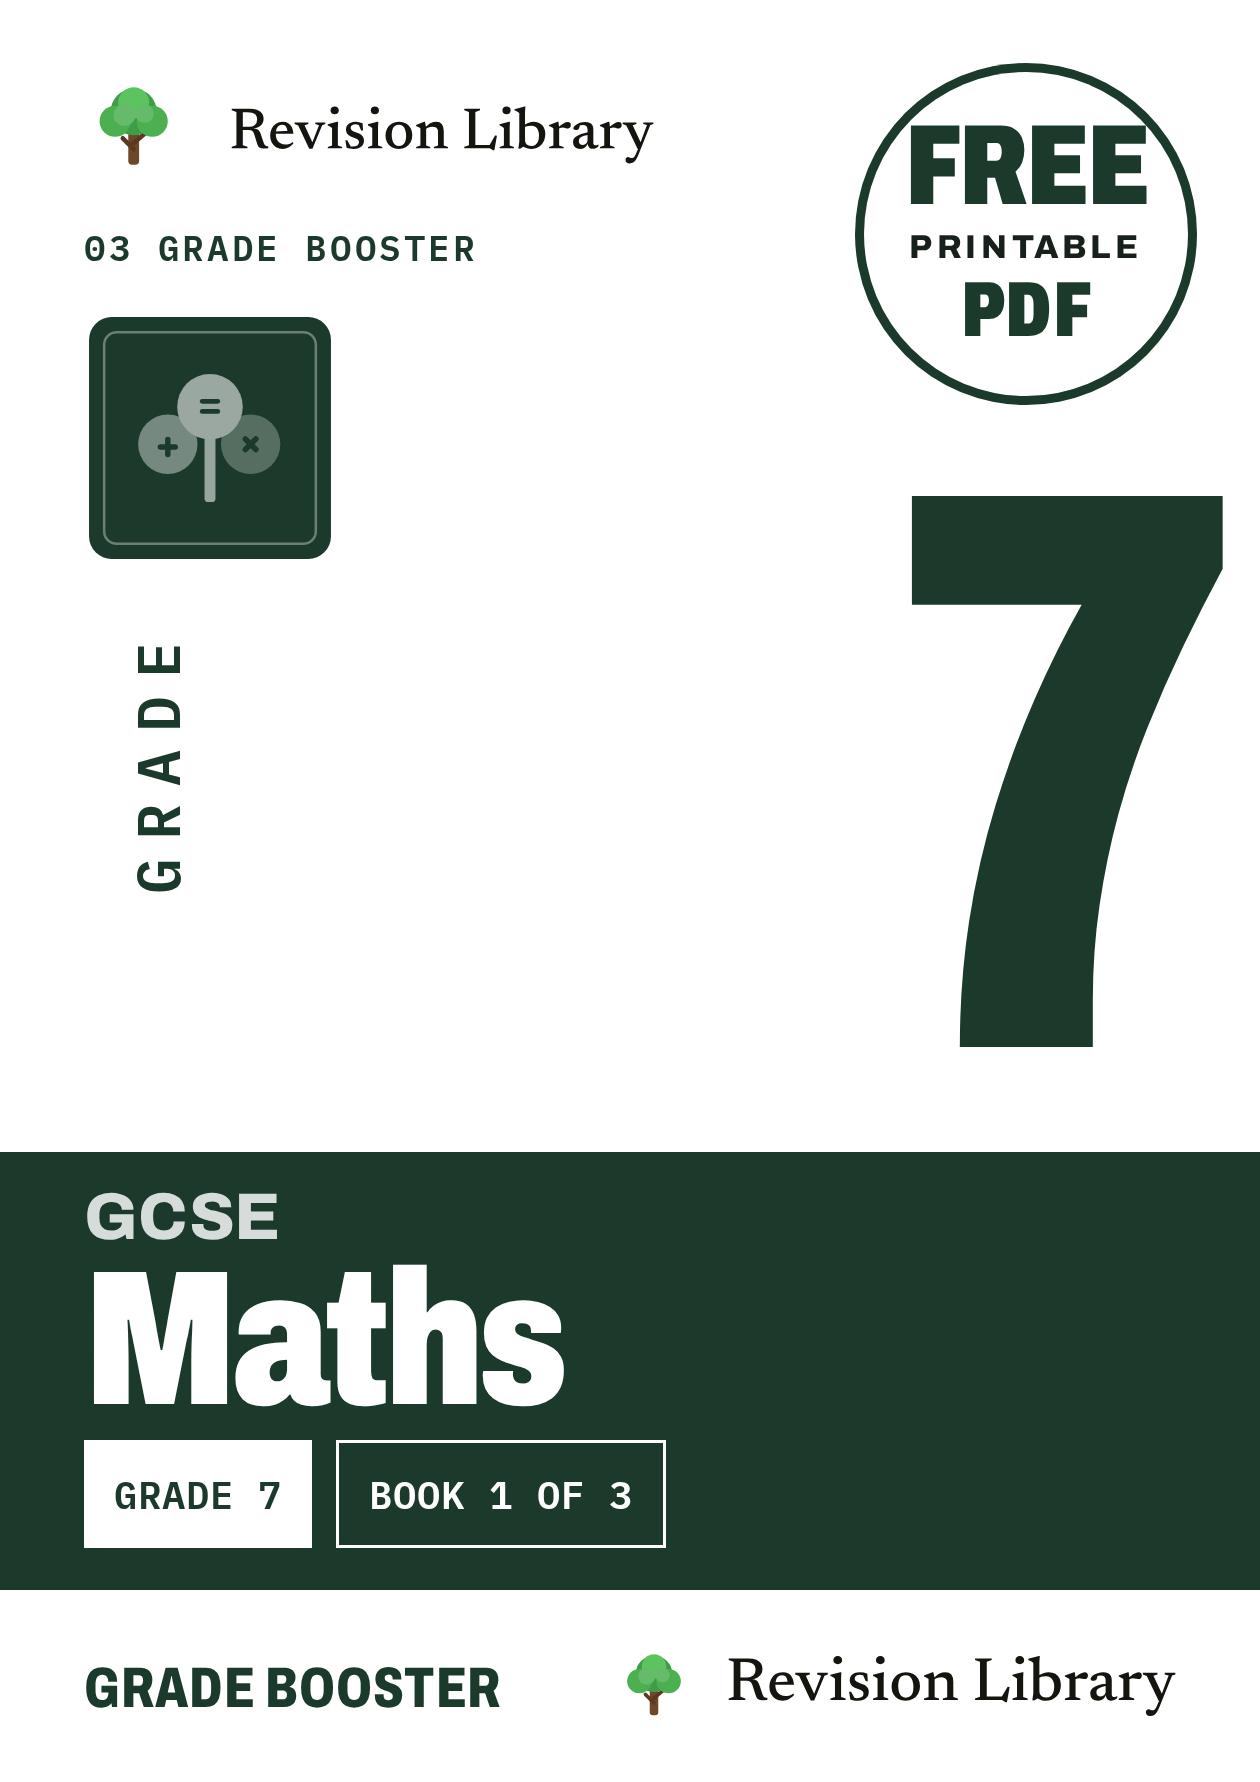
GCSE Maths Grade Boosters · Book 3 of 3

GCSE Maths Grade 7 Booster 3

Fractional and Negative Indices, The Product Rule for Counting, Repeated Percentage Change and 9 more

Level
GCSE · Edexcel 1MA1 · AQA 8300 · OCR J560
Series
GCSE Maths Grade Boosters, book 3 of 3
Suitable for
Years 10-11, AQA / Edexcel / OCR
FreePDF download · 2027 edition · 75 A4 pages
  • One file, prints straight to A4
  • No account, no password

Workbooks like this one, with 12 topics, 94 questions and mark schemes at the back, are usually printed and sold by publishers. This one is one of 558 free PDFs on the shelf.

Pages
75 A4 pages
Chapters
12 worksheet chapters
Questions
94
Answers
From page 64
Working time
About 6h

What is inside

12 chapters · answers from p64

Each chapter starts with a page showing its marks and a suggested time, followed by the questions. The mark schemes for all 12 chapters are at the back, so the book works for homework, a timed test or revision.

  1. 01Fractional and Negative Indices9 questions · about 30 min Topic guide: Fractional and Negative Indicesp3
  2. 02The Product Rule for Counting9 questions · about 30 min Topic guide: The Product Rule for Countingp7
  3. 03Repeated Percentage Change7 questions · about 30 min Topic guide: Repeated Percentage Changep11
  4. 04Expanding Triple Brackets7 questions · about 30 min Topic guide: Expanding Triple Bracketsp15
  5. 05Parallel and Perpendicular Lines6 questions · about 30 min Topic guide: Parallel and Perpendicular Linesp20
  6. 06Inequalities on Graphs8 questions · about 30 min Topic guide: Inequalities on Graphsp24
  7. 07Similar Shapes (Area and Volume)8 questions · about 30 min Topic guide: Similar Shapes (Area and Volume)p28
  8. 08Enlarging with Negative Scale Factors8 questions · about 30 min Topic guide: Enlarging with Negative Scale Factorsp33
  9. 09Circle Theorems8 questions · about 30 min Topic guide: Circle Theoremsp37
  10. 10Cumulative Frequency8 questions · about 30 min Topic guide: Cumulative Frequencyp46
  11. 11Box Plots8 questions · about 30 min Topic guide: Box Plotsp53
  12. 12Capture Recapture8 questions · about 30 min Topic guide: Capture Recapturep59
  13. AnswersMark schemes for every chapterp64

Each chapter is drawn from one of our worksheet packs. Follow a chapter title for the full pack on its own page, or browse every GCSE Maths pack. Every book on the shelf is a complete printable workbook of up to 120 A4 pages.

Explore this volume

GCSE Maths Grade 7 Booster 3 includes Fractional and Negative Indices (from page 3); The Product Rule for Counting (from page 7); Repeated Percentage Change (from page 11); Expanding Triple Brackets (from page 15); Parallel and Perpendicular Lines (from page 20); Inequalities on Graphs (from page 24); Similar Shapes (Area and Volume) (from page 28); Enlarging with Negative Scale Factors (from page 33); Circle Theorems (from page 37); Cumulative Frequency (from page 46); Box Plots (from page 53); Capture Recapture (from page 59).

Worked question 8 - Cumulative Frequency

Open the included worksheet

A student has recorded the following five-number summary for a data set, and claims it represents a valid box plot.

Minimum = 8, Lower quartile = 15, Median = 12, Upper quartile = 20, Maximum = 25

Explain why this five-number summary cannot be correct, and state what must be true instead.

Answer and mark scheme

Question 8

CreditAnswer or working
B1identify the contradiction: the median (12) is less than the lower quartile (15)
B1valid explanation, e.g. the lower quartile is the value below which approximately 25% of the data lies, and the median is the middle value with 50% of the data below it, so the median must always be greater than or equal to the lower quartile oe
B1correct statement of what must change, e.g. the median value must be at least 15 (and no more than 20); the data must have been recorded or plotted incorrectly oe
  • Answer: The summary is invalid because the median (12) is less than the lower quartile (15); the median must be at least 15.
Question 2 - Cumulative Frequency

Open the included worksheet

Box plots showing the number of hours spent revising in the two weeks before a mock exam are shown below for a sample of Year 10 students and a sample of Year 11 students.

Year 10: minimum = 2, lower quartile = 5, median = 8, upper quartile = 11, maximum = 16
Year 11: minimum = 4, lower quartile = 9, median = 13, upper quartile = 19, maximum = 20
Revision hours in the two weeks before a mock exam Year 10 2 5 8 11 16 Year 11 4 9 13 19 20 0 2 4 6 8 10 12 14 16 18 20 Number of hours spent revising
(a)Find the interquartile range for Year 10 and for Year 11.(2)
(b)Compare the revision times of the Year 10 and Year 11 students, using the median and the interquartile range.(2)

Answer and mark scheme

Question 2

CreditAnswer or working
B1(a) Year 10 IQR = 6 cao
B1(a) Year 11 IQR = 10 cao
B1(b) median comparison in context ft, e.g. Year 11 students typically revised for longer than Year 10 students, since their median (13 hours) is higher than Year 10's (8 hours)
B1(b) IQR/spread comparison in context ft, e.g. the amount of time Year 11 students spent revising was more variable/spread out than Year 10's, since their IQR (10 hours) is greater than Year 10's (6 hours)
  • (a) Answer: Year 10: 6 hours; Year 11: 10 hours
  • (b) Answer: Year 11 students revised for longer on average (higher median) and their revision times were more variable (higher IQR) than Year 10 students.

Question 5 - Cumulative Frequency

Open the included worksheet

A delivery depot records the weights, w kg, of 80 parcels sent in one day.
Weight, w (kg)Frequency
0 < w ≤ 25
2 < w ≤ 413
4 < w ≤ 623
6 < w ≤ 821
8 < w ≤ 1012
10 < w ≤ 126
Parcel weights (80 parcels) 0 2 4 6 8 10 12 0 10 20 30 40 50 60 70 80 Weight, w (kg) Cumulative frequency
(a)Complete the cumulative frequency table below.
Weight, w (kg)Cumulative frequency
w ≤ 25
w ≤ 418
w ≤ 6...
w ≤ 862
w ≤ 10...
w ≤ 1280
(2)
(b)Write down the coordinates you would plot to represent the class 6 < w ≤ 8.(1)
(c)The cumulative frequency graph for this data is shown above. Use the graph to estimate the median weight of a parcel.(2)

Answer and mark scheme

Question 5

CreditAnswer or working
B1(a) w ≤ 6 : 41 cao
B1(a) w ≤ 10 : 74 cao
B1(b) (8, 62) cao
M1(c) identifying the median position as the 40th value (n/2 = 40) and interpolating between (4,18) and (6,41)
A1(c) awrt 5.9 kg (accept 5.5-6.3)
  • (a) Answer: 41 and 74
  • (b) Answer: (8, 62)
  • (c) Answer: awrt 5.9 kg

Question 7 - Capture Recapture

Open the included worksheet

For n1 = 30, n2 = 40 and m = 6, show that the Lincoln-Petersen estimate is N = 200, and show that the proportion of marked animals in the second sample (m/n2) is consistent with this estimate, since it is approximately equal to the proportion of the population marked originally (n1/N). You must show all calculations.

Answer and mark scheme

Question 7

CreditAnswer or working
M1Lincoln-Petersen calculation: N = 30 * 40 / 6 = 200 shown oe
M1calculate both proportions: m/n2 = 6/40 = 0.15 and n1/N = 30/200 = 0.15
C1conclude the two proportions are equal (both 0.15), confirming the estimate is consistent cso
  • Answer: Lincoln-Petersen: N = 30 * 40 / 6 = 200. m/n2 = 6/40 = 0.15 and n1/N = 30/200 = 0.15; the two proportions are equal, so the estimate N = 200 is consistent with the data.

Question 6 - Capture Recapture

Open the included worksheet

A pond snail population is estimated using capture-recapture. In the first sample, 52 snails are marked. In the second sample of 38 snails, 7 are marked.
(a)Calculate an estimate for the population of snails, giving your answer to 3 significant figures.(2)
(b)Explain why it would not be appropriate to report the final population estimate as a decimal.(1)

Answer and mark scheme

Question 6

CreditAnswer or working
M1(a) 52 x 38 / 7 oe
A1(a) 282 (awrt, 3 sf)
B1(b) the number of snails must be a whole number, as you cannot have a fraction of a living snail
  • (a) Answer: 282 snails (3 s.f.)
  • (b) Answer: A population must be a whole number of animals, so a decimal answer does not make sense in context.

Question 6 - Box Plots

Open the included worksheet

The five-number summary for the mass, in kg, of 45 parcels processed at a delivery depot is:

Minimum = 2, Lower quartile = 6, Median = 9, Upper quartile = 14, Maximum = 20

On the grid provided, draw a box plot for this data.
Mass of parcels (kg) - grid for your box plot 0 4 8 12 16 20 Mass of parcel (kg)

Answer and mark scheme

Question 6

CreditAnswer or working
B1box drawn correctly from the lower quartile (6) to the upper quartile (14)
B1median (9) correctly marked with a vertical line inside the box
B1whiskers drawn correctly from the box to the minimum (2) and to the maximum (20)
B1correct linear scale used with the axis labelled (mass, kg)
  • Answer: Box plot with min 2, LQ 6, median 9, UQ 14, max 20 (kg).

Question 7 - Box Plots

Open the included worksheet

The box plot below shows the ages, in years, of members at a running club.

Minimum = 10, Lower quartile = 20, Median = 22, Upper quartile = 40, Maximum = 44

Describe the skewness of the distribution, giving a reason for your answer.
Ages (years) of members at a running club 10 20 22 40 44 0 5 10 15 20 25 30 35 40 45 50 Age (years)

Answer and mark scheme

Question 7

CreditAnswer or working
B1correct conclusion: the distribution is positively skewed (skewed to the right, towards older ages) oe
B1valid reason, e.g. the gap between the upper quartile and the median (40 - 22 = 18) is much bigger than the gap between the median and the lower quartile (22 - 20 = 2), showing greater spread among the older members oe
  • Answer: Positively (right) skewed

GCSE Maths Grade Boosters runs to 3 volumes

Book 3 of 3 · 244 pages in the set

Each book is a separate free PDF.

Volume 1

84 pp · 111 Qs

Indices, Expanding and Factorising, Pythagoras and 12 more

Volume 2

85 pp · 100 Qs

Solving Simultaneous Equations Graphically, Gradient of a Line, Equation of a Line and 9 more

Volume 3 · this book

75 pp · 94 Qs

Fractional and Negative Indices, The Product Rule for Counting, Repeated Percentage Change and 9 more

More GCSE books

Want a different mix of topics?

Sitting an exam soon? Build a GCSE Maths mock paper or print a ready-made one.