Revision Library
Choose a subject
Menu

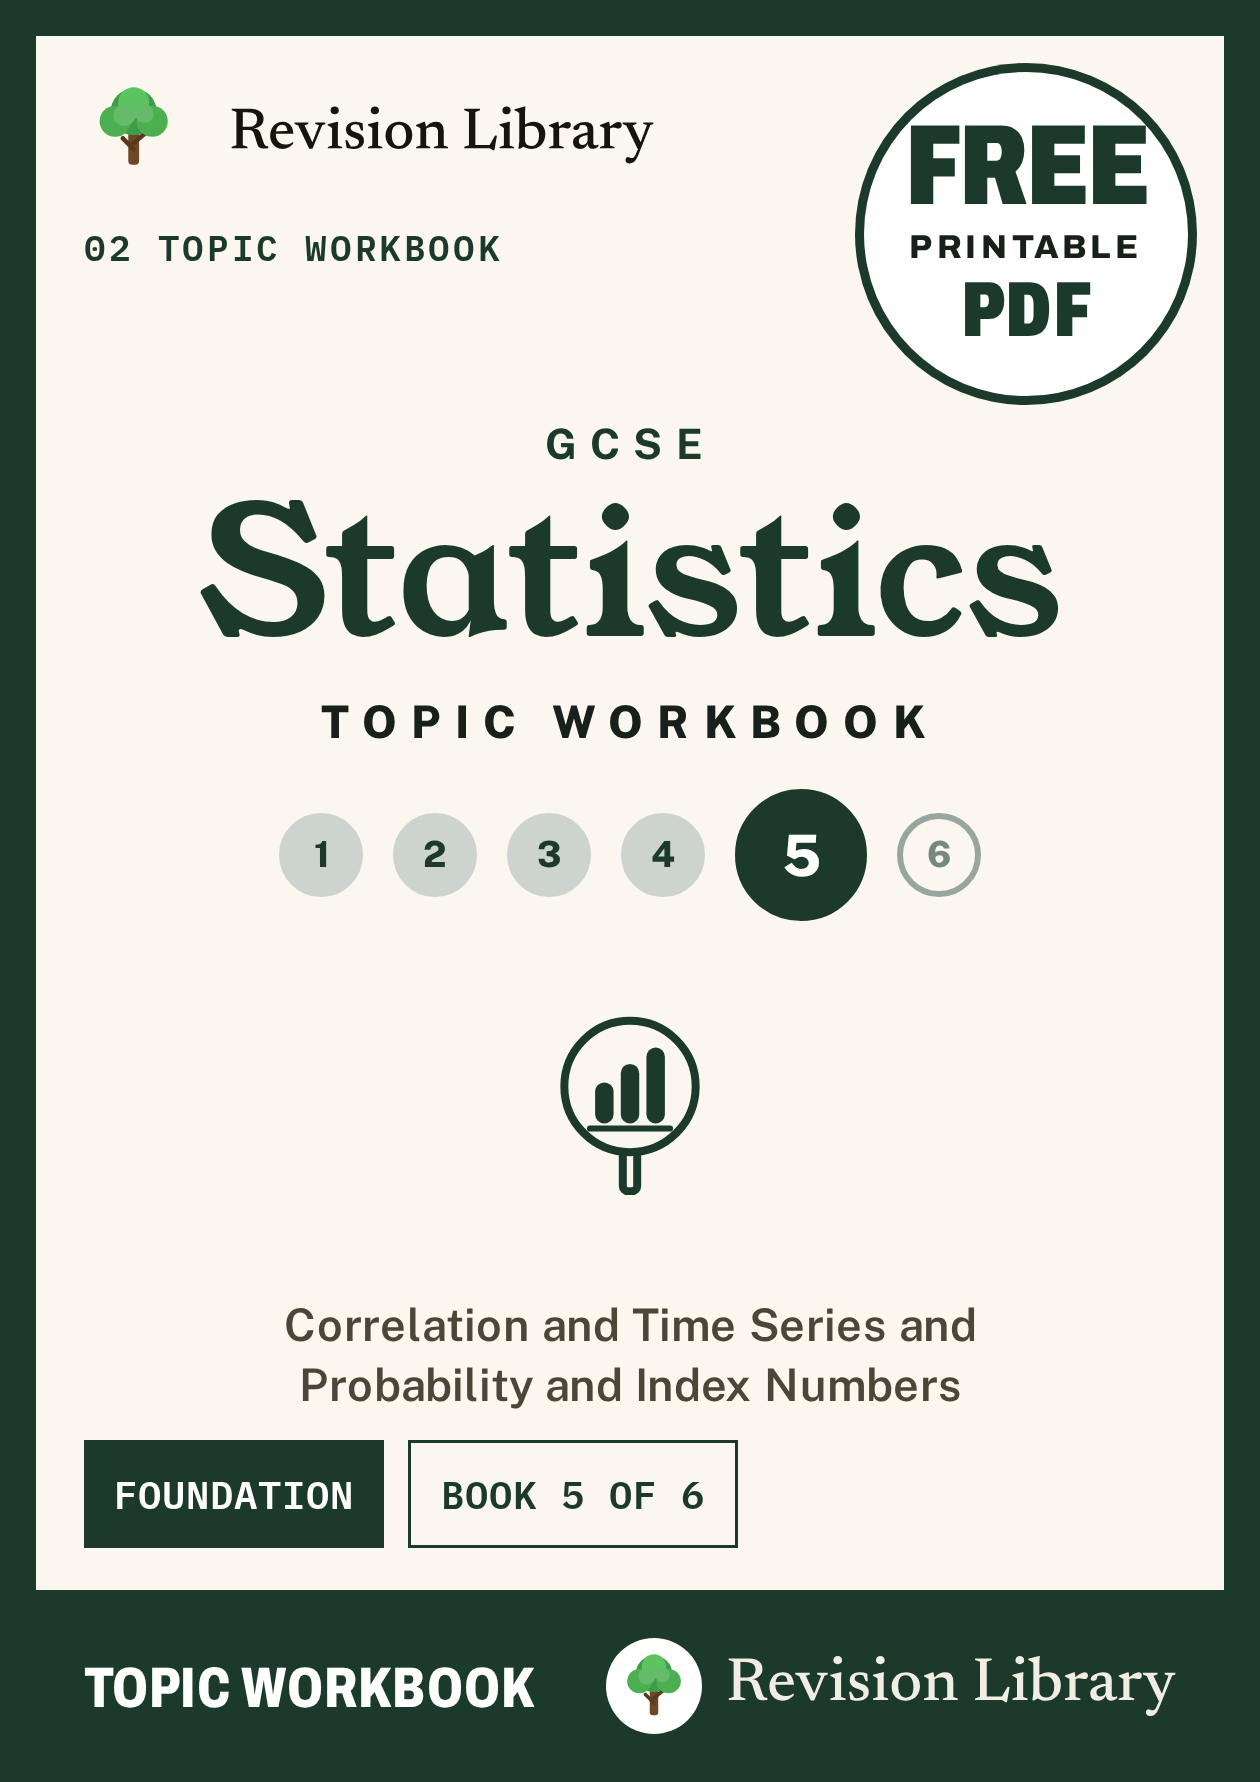
GCSE Statistics Foundation Topic Workbooks · Book 5 of 6

GCSE Statistics Foundation Topic Workbook 5

Correlation and Causation (Foundation), Spearman's Rank Interpretation, Time Series and Moving Averages and 5 more

Level
GCSE Foundation · Edexcel 1ST0
Series
GCSE Statistics Foundation Topic Workbooks, book 5 of 6
Suitable for
Years 10-11, Edexcel
FreePDF download · 2027 edition · 107 A4 pages
  • One file, prints straight to A4
  • No account, no password

Workbooks like this one, with 8 topics, 100 questions and mark schemes at the back, are usually printed and sold by publishers. This one is one of 558 free PDFs on the shelf.

Pages
107 A4 pages
Chapters
8 worksheet chapters
Questions
100 · 452 marks
Answers
From page 92
Working time
About 7h 55m

What is inside

8 chapters · answers from p92

Each chapter starts with a page showing its marks and a suggested time, followed by the questions. The mark schemes for all 8 chapters are at the back, so the book works for homework, a timed test or revision.

  1. 01Correlation and Causation (Foundation)15 questions · 52 marks · about 55 min Topic guide: Correlation and Causation (Foundation)p3
  2. 02Spearman's Rank Interpretation12 questions · 47 marks · about 50 min Topic guide: Spearman's Rank Interpretationp15
  3. 03Time Series and Moving Averages11 questions · 54 marks · about 55 min Topic guide: Time Series and Moving Averagesp25
  4. 04Scatter Graphs and Line of Best Fit12 questions · 55 marks · about 60 min Topic guide: Scatter Graphs and Line of Best Fitp35
  5. 05Time Series13 questions · 58 marks · about 60 min Topic guide: Time Seriesp50
  6. 06Risk (Foundation)12 questions · 67 marks · about 70 min Topic guide: Risk (Foundation)p61
  7. 07Conditional Probability (Foundation)13 questions · 64 marks · about 65 min Topic guide: Conditional Probability (Foundation)p72
  8. 08Probability Basics and the Probability Scale12 questions · 55 marks · about 60 min Topic guide: Probability Basics and the Probability Scalep82
  9. AnswersMark schemes for every chapterp92

Each chapter is drawn from one of our worksheet packs. Follow a chapter title for the full pack on its own page, or browse every GCSE Statistics pack. Every book on the shelf is a complete printable workbook of up to 120 A4 pages.

Explore this volume

GCSE Statistics Foundation Topic Workbook 5 includes Correlation and Causation (Foundation) (from page 3); Spearman's Rank Interpretation (from page 15); Time Series and Moving Averages (from page 25); Scatter Graphs and Line of Best Fit (from page 35); Time Series (from page 50); Risk (Foundation) (from page 61); Conditional Probability (Foundation) (from page 72); Probability Basics and the Probability Scale (from page 82).

Worked question 14 - Correlation and Causation (Foundation)

Open the included worksheet

A student wants to investigate whether there is a relationship between the number of hours people spend using a smartphone each day and the number of hours they sleep at night. She plans to survey 15 adults.
(a)Plan: Give one reason why the student should choose a random sample of adults, rather than just asking her friends, when planning her survey.(1)
(b)Collect: Give a method the student could use to collect the smartphone usage data, and state one advantage of this method over asking people to estimate from memory.(2)
(c)Process: The student plots her data on a scatter graph and adds a line of best fit. Describe one way she could check that her line of best fit is appropriate.(1)
(d)Interpret: The completed scatter graph shows a negative correlation. State what this suggests about smartphone use and sleep, and explain why the student should not conclude that using a smartphone directly causes people to sleep less.(3)

Answer and mark scheme

Question 14

CreditAnswer or working
B1(a) a random sample is more likely to be representative of adults in general, whereas her friends may share similar ages or habits and could bias the results
B1(b) valid method, e.g. use the 'screen time' data recorded automatically in the smartphone's settings
B1(b) advantage, e.g. this is more accurate and objective than people's memory or estimates
B1(c) check that the line passes through (or close to) the middle of the data, with a roughly equal number of points above and below it
B1(d) as daily smartphone use increases, hours of sleep tends to decrease, oe
B1(d) correlation does not prove causation
B1(d) identifies a plausible confounding variable, e.g. stress levels or a demanding work schedule could cause both more smartphone use (e.g. late-night messages) and less sleep
  • (a) Answer: A random sample is more likely to represent the whole adult population fairly; her friends might have similar ages or habits, which could bias the results.
  • (b) Answer: Use the screen time feature built into each participant's phone to record actual daily usage; this is more accurate than relying on people's memory or estimates.
  • (c) Answer: Check that the line passes through the main body of the points, with roughly equal numbers of points on each side of the line.
  • (d) Answer: As daily smartphone use increases, hours of sleep tends to decrease. However, correlation does not prove causation: a third factor, such as a person's stress levels or a demanding work schedule, could cause both more smartphone use (e.g. checking messages late at night) and less sleep, without one directly causing the other.

Question 15 - Correlation and Causation (Foundation)

Open the included worksheet

A seaside museum's ice cream van keeps a record, over 9 days, of the number of museum visitors and the van's daily takings, in pounds. One day's data is unusual: a school arranged a large visit to the museum on a cold, wet day, giving high visitor numbers but very low ice cream takings.
0 50 100 150 200 250 300 £0 £30 £60 £90 £120 £150 Number of museum visitors Ice cream van takings (£)
(a)Describe the correlation shown by the scatter graph, ignoring the unusual point.(2)
(b)A visitor comments: 'More people visiting the museum causes more ice cream to be sold.' Using the context, explain why this conclusion is not fully reliable, referring to a possible confounding factor.(2)

Answer and mark scheme

Question 15

CreditAnswer or working
B1(a) positive correlation
B1(a) identifies/excludes the outlier, e.g. the point at 260 visitors, £15 takings, before describing the trend
B1(b) correlation does not prove causation
B1(b) identifies a plausible confounding factor, e.g. warm sunny weather brings more people out to both the museum and the ice cream van; the unusual school-trip day shows visitor numbers can rise for reasons unrelated to ice cream sales
  • (a) Answer: Positive correlation (ignoring the outlier at 260 visitors, £15 takings).
  • (b) Answer: The correlation does not prove that museum visitors directly cause ice cream sales. Warm, sunny weather is a likely confounding factor, bringing more people out to both the museum and the ice cream van. The unusual day (high visitors, low takings, due to a school trip on a cold, wet day) shows that visitor numbers can rise for reasons unrelated to ice cream sales, supporting the idea that a third factor, not direct causation, explains the pattern.

Question 13 - Correlation and Causation (Foundation)

Open the included worksheet

Fire brigade records show that fires attended by a larger number of fire engines tend to result in more damage, in pounds. A local councillor claims: 'Sending fewer fire engines to fires would reduce the amount of damage caused.' Explain why the councillor's claim is not supported by this data.

Answer and mark scheme

Question 13

CreditAnswer or working
B1correlation does not prove causation
B1identifies the size or severity of the fire as the confounding variable: a larger, more serious fire causes both more fire engines to be sent and more damage, rather than the fire engines causing the damage
  • Answer: The claim is not supported. The confounding variable is the size (severity) of the fire: a larger fire causes both more fire engines to be sent and more damage, so the number of fire engines does not cause the damage. Sending fewer engines to a serious fire could make the damage worse, not better.

Question 7 - Risk (Foundation)

Open the included worksheet

A student wants to investigate the statement: "Older drivers have a lower risk of being involved in a car accident than younger drivers."
(a)Plan: Write a suitable question the student could use to plan this investigation.(1)
(b)Collect: Suggest one source of secondary data the student could use to collect data on accident rates by age group.(1)
(c)Process: The student finds that, in one year, 1 in 25 drivers aged 17 to 25 was involved in an accident, compared with 1 in 200 drivers aged over 50. Work out how many times more likely a driver aged 17 to 25 is to be involved in an accident than a driver aged over 50.(2)
(d)Interpret: Write a conclusion the student could make, interpreting this result in the context of the original statement.(1)

Answer and mark scheme

Question 7

CreditAnswer or working
B1(a) any suitable comparative question linking driver age and accident risk, e.g. 'Do drivers aged over 50 have a lower risk of being involved in an accident than drivers aged 17 to 25?', oe
B1(b) any suitable named or described source, e.g. GOV.UK road casualty statistics, an insurance company's claims data, or DVLA/police records, oe
M1(c) 200 divided by 25, oe
A1(c) 8 (times) cao
B1(d) conclusion consistent with the 8-times figure supporting the original statement, e.g. 'This supports the statement: drivers aged 17-25 have a much higher (8 times higher) risk of an accident than drivers aged over 50', oe
  • (a) Answer: e.g. Do drivers aged over 50 have a lower risk of being involved in an accident than drivers aged 17 to 25?
  • (b) Answer: e.g. GOV.UK road casualty statistics
  • (c) Answer: 8 times
  • (d) Answer: e.g. This supports the statement: younger drivers (17-25) have a much higher risk (8 times higher) of being involved in an accident than drivers aged over 50.

Question 8 - Risk (Foundation)

Open the included worksheet

A factory tests two batches of kettles for faults.

Batch 1: risk of a fault = 3 in 100
Batch 2: risk of a fault = 1 in 40
(a)Write the risk of a fault in Batch 1 as a percentage.(1)
(b)Write the risk of a fault in Batch 2 as a percentage.(1)
(c)The factory makes 12000 kettles in Batch 1 and 8000 kettles in Batch 2. Work out the number of faulty kettles expected in each batch.(3)
(d)A manager claims, "Batch 2 is safer because fewer kettles will be faulty." Comment on whether the manager's claim is fully justified.(2)

Answer and mark scheme

Question 8

CreditAnswer or working
B1(a) 3% cao
B1(b) 2.5% cao
M1(c) 12000 x 0.03, oe
M1(c) 8000 x 0.025, oe
A1(c) 360 and 200 cao (both correct)
B1(d) recognises Batch 2 does have fewer faulty kettles overall (200 versus 360) because fewer kettles were made in that batch
B1(d) recognises the risk (rate) of a fault is actually similar/not much lower for Batch 2 (2.5% versus 3%), so comparing raw numbers alone when batch sizes differ is misleading, oe
  • (a) Answer: 3%
  • (b) Answer: 2.5%
  • (c) Answer: Batch 1 = 360, Batch 2 = 200
  • (d) Answer: Not fully justified - Batch 2 has fewer faulty kettles only because fewer kettles were made; the risk (rate) of a fault is similar for both batches (3% vs 2.5%).

GCSE Statistics Foundation Topic Workbooks runs to 6 volumes

Book 5 of 6 · 628 pages in the set

Each book is a separate free PDF.

Volume 1

98 pp · 110 Qs

Data Cleaning and Outliers (Foundation), Estimating from Samples (Foundation), Stratified Sampling (Foundation) and 5 more

Volume 2

110 pp · 103 Qs

Designing Questionnaires and Surveys, Experimental Design, Spreadsheets and ICT (Foundation) and 5 more

Volume 3

111 pp · 105 Qs

Pie Charts, Stem and Leaf Diagrams, Histograms and 5 more

Volume 4

103 pp · 100 Qs

Skewness by Inspection, Percentiles, Mean Median Mode and Range and 5 more

Volume 5 · this book

107 pp · 100 Qs

Correlation and Causation (Foundation), Spearman's Rank Interpretation, Time Series and Moving Averages and 5 more

Volume 6

99 pp · 85 Qs

Mutually Exclusive Events, Sample Space Diagrams, Relative and Expected Frequency and 4 more

More GCSE Foundation books

Want a different mix of topics?

Sitting an exam soon? Build a GCSE Statistics mock paper or print a ready-made one.